MCN selection analysis: All results
Analysis Information
Input parameters box shows information about the input parameters submitted:

Summary box shows final list used to perform Network Miner Analysis and offers you the possibility to download it. Moreover you could see the proteins/genes duplicated in your list and the proteins/genes that don't match into the interactome selected.
Results
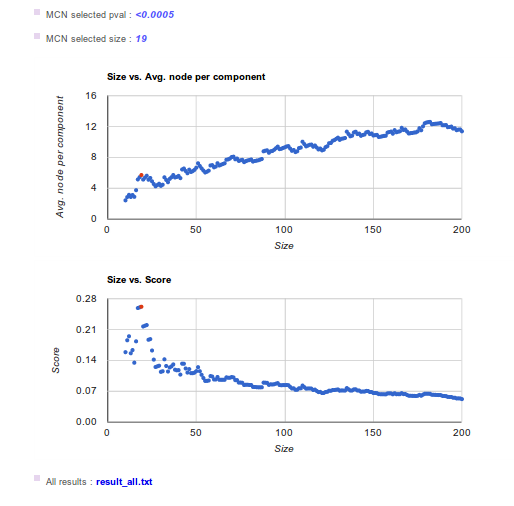
Remember that Network Miner subdivides the ranked list into a sequence of additives partitions. For any partition Network Miner maps the proteins onto the interactome scaffold and finds the minimum connected network (MCN). The first analyzed partition will contain the 10 first elements. If just one column is provided, proteins are added one to one to Network Miner analysis. If two columns are provided then proteins with equal phenotypic parameter are added together. Subnetwork evaluation is performed by comparing phenotype associated MCNs versus 10000 random MCNs with the same number of proteins/genes. Based on the features of each MCN (number of components and number of proteins forming it), we can obtain an estimate of a p value simply by ranking the feature of the MCN of interest on randoms MCN. Thus, p values of comparisons with alternative greater are obtained.
In Results box you could find results from all MCNs evaluation (result_all.txt file). In this file, each row represents a MCN evaluation while columns represents:
- MCN Size: number of genes or proteins used to map onto the interactome scaffold.
- MCN former Nodes: genes or proteins id's used to do it.
- MCN p-value: comparison MCN of interest Vs randoms MCN p-value.
Also, there are the p-value and the size (number of proteins/genes) corresponding to the higher p-value MCN.

