Results
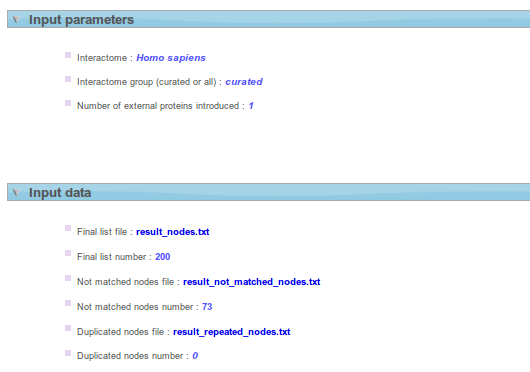
Input parameters & Input data information
- Input parameters box shows information about the input parameters submitted.
- Remember that in Funcional Genomics, data must be processed before start the analysis (id conversion, control filters, etc). Here, the proteins/ genes for which there is no ppi annotated are removed from the list. Input data shows final list used before perform Network Miner Analysis and offers you the possibility to download it. In this section you can see the number of proteins/genes duplicated in your list and the number of proteins/genes that don't match into the interactome selected.
Results: Minimum Connected Network selected
All results
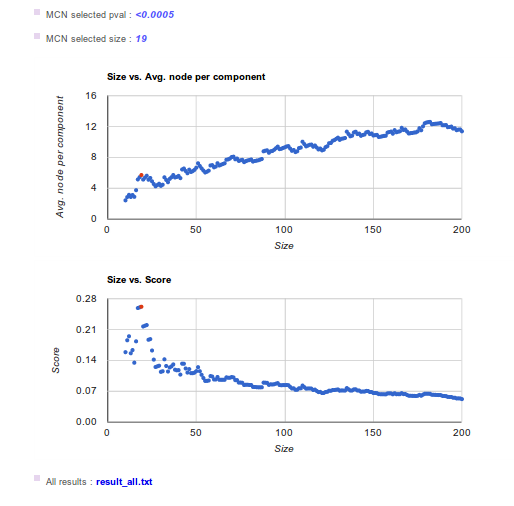
Remember that Network Miner subdivides the ranked list into a sequence of additives partitions. For any partition Network Miner maps the proteins onto the interactome scaffold and finds the Minimum Connected Network (MCN). The partition of interest is the sublist that provides a new protein capable of connecting to the previous ones. This can be identified through the relative maxima for the parameter of interest (average nodes per component). These relative maxima are selected as potential points of interest and the score is calculated. Based on the partition score, we select the MCN of interest and obtain the p-values. MCN p-value is obtained by comparing the MCNs selected versus 2000 random MCNs with the same number of proteins/genes (which corrects the effect of size). Here you can find the algorithm used to find the MCN. Figures in the results page show parameters evolution versus sublist size. The selected sublist is represented as a red point.
The first plot represents the average nodes per component against the size of the sublist analyzed. The relative maxima indicates the sublist that provides a new protein capable of connecting to the previous ones. The second plot show the score against the size of the sublist analyzed. The score can be seen as a balance between the increase in nodes connected between them and the distance to the top of the ranked list and is used to discriminate between relative maxima.
In Results box you could find results from all MCNs evaluation (result_all.txt file). In this file each row represents a MCN evaluation while columns represent:
- MCN Size: number of genes or proteins used to map onto the interactome scaffold.
- MCN former Nodes: genes or proteins id's used.
- MCN p-value: comparison MCN of interest Vs randoms MCN p-value.
- MCN average nodes per component value.
- MCN score.
Viewer
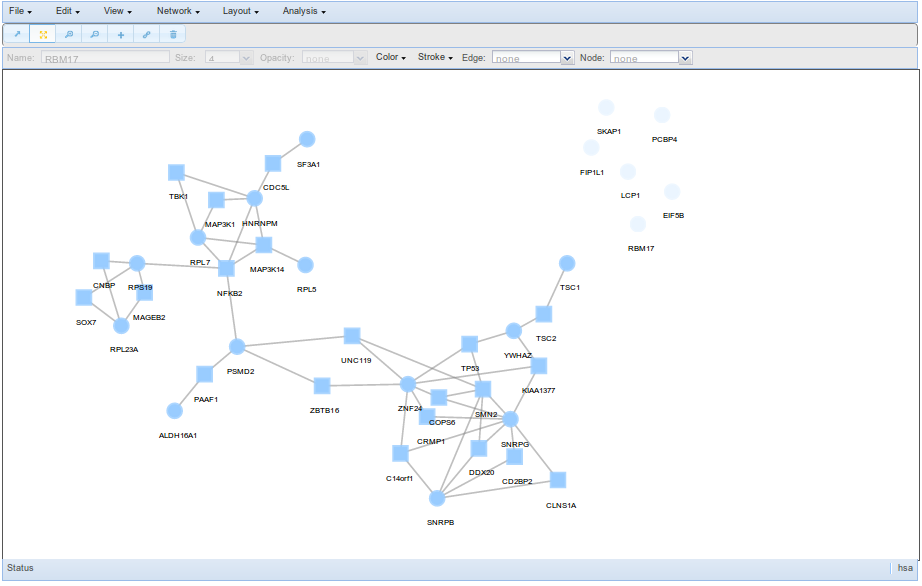
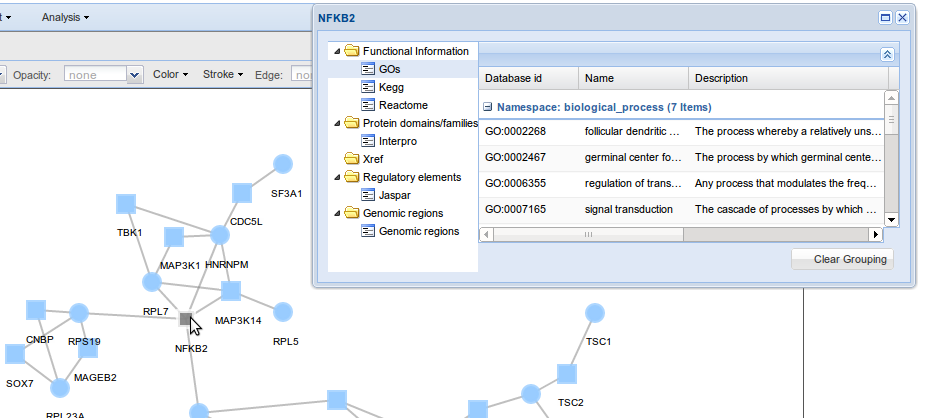
Users may view the network generated through a user friendly window that allows to manipulated the network and obtain functional information interactively.
The viewer has several options to facilitate the exploration of the MCN, some examples are the possibility of colouring nodes by GO terms, hiding nodes or edges that can be restored afterwards, performing another layout, etc. For more information about
the Viewer, see Network viewer section.
Interactors
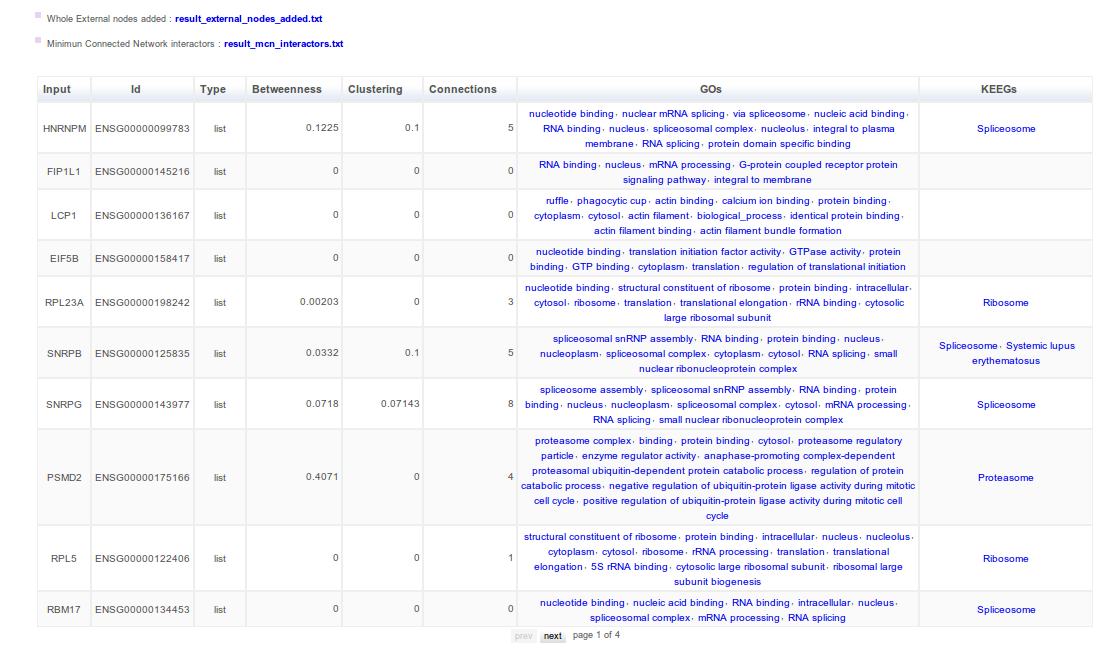
A table describing MCN interactors is shown. Here you can find the topological role of your proteins-genes in the MCN (relative betweenness, connection degree and clustering coefficient parameters) and also some functional information (GO and Kegg). Exactly the table has 8 columns with:
- Input_id, the input id.
- Id, the corresponding ensemble/uniprot id.
- Type, refers to the origin of the node. Nodes will be labeled as “list” if the protein/gene is in your initial testing list or “external” if is an external protein/gene used to draw the MCN.
- Relative betweenness, topological parameter that accounts for the centrality of the node within the MCN.
- Clustering coefficient, a measure of connectivity that evaluates how connected is the node neighbourhood.
- Connection degree, the number of node connections.
- Go, Gene Ontology terms associated to the node.
- Kegg, Kegg pathways associated to the node.
- result_external_nodes_added.txt is a tabulated file that contains external interactors added to drawn the MCN.
- result_mcn_interactors.txt is a tabulated file that contains all information about interactors.
Continue processing
Here you can send the MCN to other Babelomics tools such as FatiGO and SNOW.
- FatiGO: Provides significant over-representation of functional annotations in your MCN versus the whole interactome by single enrichment analysis
- SNOW: PPI Network enrichment analysis. Evaluates, on the one hand, the role of the MCN within the whole interactome and, on the other hand, the cooperative behaviour of the MCN.
FatiGO
The FatiGO default analysis tests for over-representation of functional terms in the subnetwork compared against the same interactome selected in Network Miner analysis. The input list to FatiGO tool contains every subnetwork node, excluding isolated interactors (interactors with any connection in the subnetwork). If external nodes have been incorporated, FatiGO input list will include also these external nodes. The available functional terms to search for enrichment are GO, Kegg, Reactome, Biocarta, Interpro, miRNA targets and jaspar TFBS databases.
SNOW
The SNOW default analysis tests for over/under-representation of topological parameters in the subnetwork compared against the same interactome, allowing the same number of external nodes selected in Network Miner analysis. The input list to SNOW tool is the sublist selected in Network Miner, including isolates nodes. If external nodes have been incorporated in Network Miner, SNOW input list will not include them in order to preserve the same characteristics than Network Mine analysis.
