Table of Contents
PATHiPRED result interpretation
The output is divided in three sections. The first one is referred to the technical details of the job. The second one is a clickable index of the results. Finally, the third one shows the selected results. These results include a summary of the main statistical parameters that show the goodness of the fitted model, the selected subpathways, the confusion matrix, PATHiWAYS probabilities matrix and the prediction model. Moreover, the third section also includes individual results of each selected pathway (a graphical representation of the selected subpathways in their pathway context).
1. Information
This section has information about:
- Job name
- Date/time
- Parameters selected in the input form
From this section you can download, delete, launch PATHiWAYS with this dataset or predict a new dataset applying the result model.
2. Index
This section is an index of the results. The first item (Summary) contains the result tables of the methodology and the following items are the selected pathways that show graphical information. When you click any of these items, the results related to it are shown in Details section.
3. Details
In this section are shown all the results of the prediction. In the top area of this section there are several tabs, one for each result in the index section. You can select the results of your interest just clicking in the corresponding tab or selecting it in Index section.
Note that for PATHiPRED-prediction tool (applying a previously obtained model to a new dataset), results comprise only the Summary section, including prediction results instead of selected features and pathiways probabilities.
3.1 Summary
Four files are included in this section:
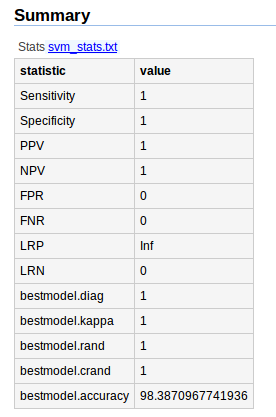
- svm_stats.txt contains all statistical paremeters to assess the fitted model with activation probabilities of subpathways.
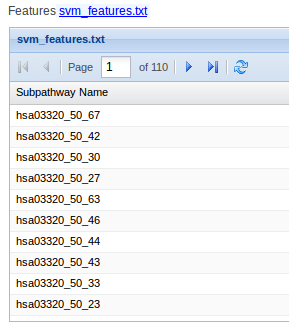
- svm_features.txt contains the selected subpathways that distinguish between two conditions.
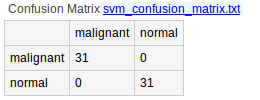
- svm_confusion_matrix.txt is the result of the prediction (only if the experimental variable type is categorical).
- pathiways_probabilities.txt is the probabilities matrix used to obtain the SVM model.
- svm_bestmodel.RData is the SVM best model obtained in R format.
3.2. Pathways results
The best way to interpret this results is to map them in a pathway context. For this aim, PATHiPRED tool provides a representation of the results in the KEGG modelled network. Each tab includes graphical interpretation in a pathway context.
We codify in YELLOW the genes and relationships that were used to generate the prediction model between two classes or a continuous variable.


