Table of Contents
PATHiWAYS result interpretation
The details about how to launch this example are in Worked examples section. Another way to launch the example is to click Load example1.Colorectal cancer link (all the fields will be automatically filled) and press run button.
When the job becames green, you can click it and a new results tab will appear.
The output
The output is divided in three sections. The first one is referred to the technical details of the job. The second one is a clickable index of the results. Finally, the third one shows the selected results. These results include a summary of the whole pathway behaviour and individual results to each selected pathway (each of one has three types of results: a table with the numerical results, a graphical representation of the results and a graphical interpretation of the results in a pathway context).
1. Information
This section has information about:
- Job name
- Date/time
- Parameters selected in the input form
2. Index
This section in an index of the results. The last item (Summary) is summary table of all the results, and the following items are the selected pathways. When you click any of these items, the results related to it are shown in Details section. If no item is selected, first selected pathway results are shown.
3. Details
In this section the results about each selected pathway and a summary of all of them is shown. In the top area of this section there are several tabs, one for each result in the index section. You can select the results of your interest just clicking in the corresponding tab or selecting it in Index section.
3.1. Summary
- Pathway name: Name of the pathway in KEGG database
- Mean: Stimated mean of the activation diference in the whole pathway between two conditions
- Upper limit, Lower limmit: Up and low limits of the confidence interval of the stimated mean.
- UP/DOWN: Indicate if the whole pathway is UP (more activated in the second condition) or DOWN (more activated in the first condition). If the difference of activation is exactly zero, we indicate it with 0.
- Significance: Indicate if the UP/DOWN column is significant. A result is significant, if its confidence interval do not contain zero. YES indicated that the pathway is significant UP/DOWN and NO indicate the opposite.
- SubpathsUP(sign): Number of subpathways UP (more activated in the second condition) and between brackets how many of them are significant.
- SubpathsDOWN(sign): Number of subpathways DOWN (more activated in the first condition) and between brackets how many of them are significant.
- SubpathsNEUTRAL(sign): Number of subpathways 0 (without activation diferences between conditions) and between brackets how many of them are significant.
3.2. Pathways results
This section has the same structure for each selected pathway.
Numerical results
- Subpathway name: Name of the subpathway indicating the stimulus and response genes. It is representing as STIMULUS-RESPONSE.
- Mean: Stimated mean of the activation diference in the subpathway between two conditions
- Upper limit, Lower limmit: Up and low limits of the confidence interval of the stimated mean.
- UP/DOWN: Indicate if the subpathway pathway is UP (more activated in the second condition) or DOWN (more activated in the first condition). If the difference of activation is exactly zero, we indicate it with 0.
- Significance: Indicate if the UP/DOWN column is significant. A result is significant, if its confidence interval do not contain zero. YES indicated that the pathway is significant UP/DOWN and NO indicate the opposite.
Graphical representation
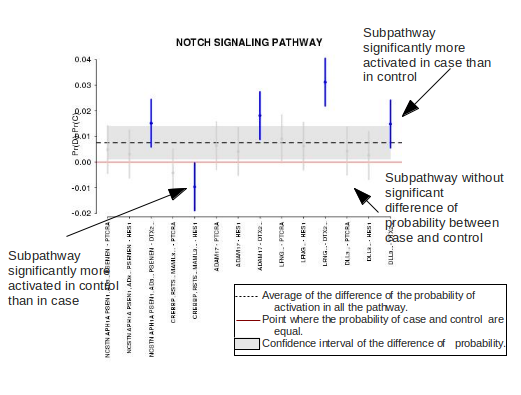
The final result is a plot for each pathway, where the difference in activation between two conditions of each stimulus-response subpathway and also the difference of activation for the whole pathway is shown.
In the plot we can see: - The red line only mark the zero, in other words, the point where the probability of the disease is equal the probability of the control. - The black dotted line is the average of the difference of the probability of activation in all the pathway and the gray area is the confidence interval of this difference of probability. - The vertical bars represent the difference of the probability of activation in each path. (the names below are the name of the entry and the name of the exit separated by a bar). When the difference of probability of activation in a path is significant, this bar is blue, in other cases this bar is gray.
Graphical interpretation in pathway context
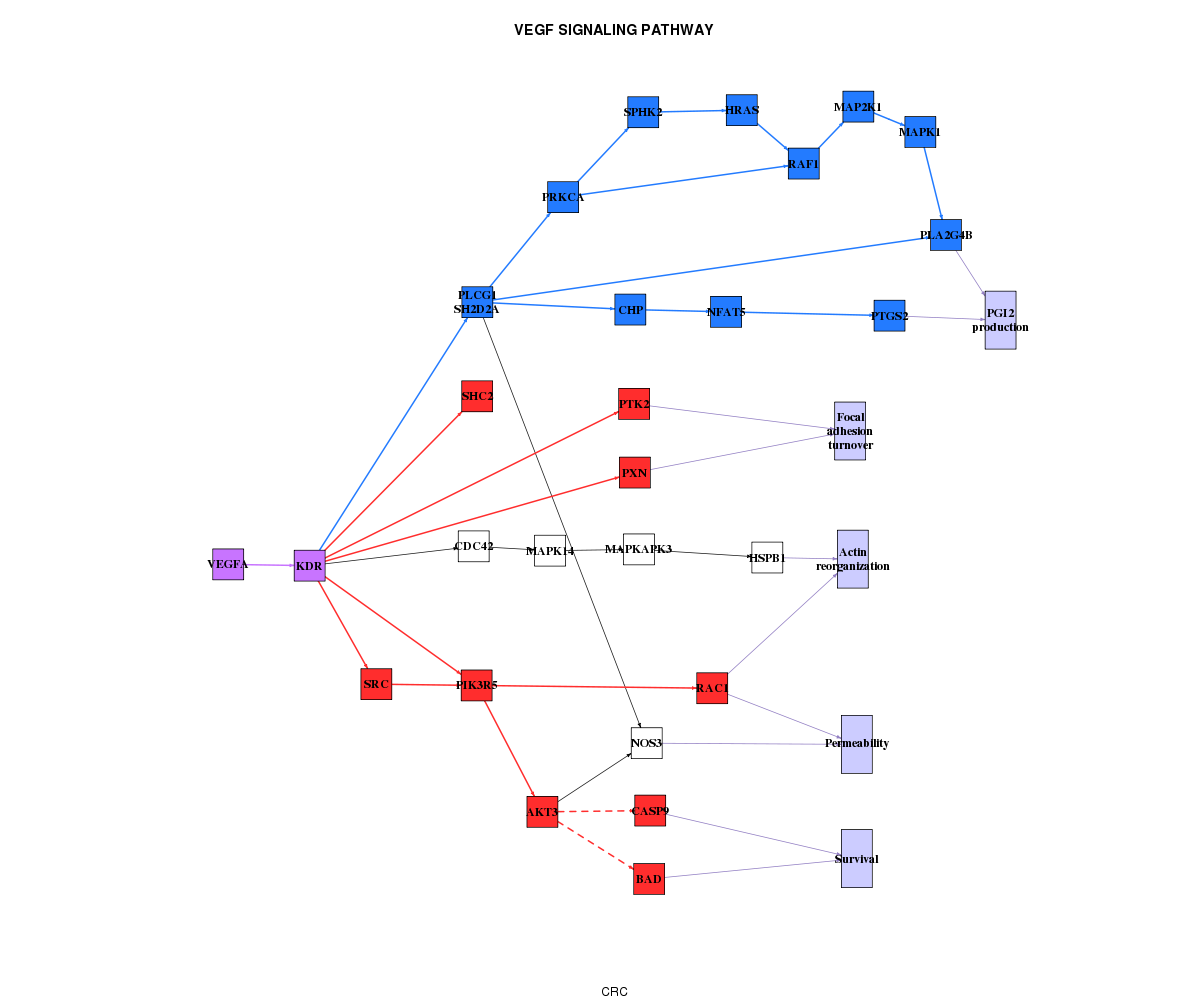
The best way to interpret this results is to map them in a pathway context. For this aim, PATHiWAYS tool provide a representation of the results in the KEGG modelled network.
We codify in BLUE the genes and relationships that belongs to subpathways significantly more activated in the first condition (DOWN) and in RED the genes and relationships that belongs to subpathways significantly more activated in the second condition. The genes that belong to subpathways UP and DOWN are in PURPLE. The green ones are that does not belong to any significant subpathway.


