Presentation
Web usage
Data Management
Data Preprocessing
Expression Data Analysis
Genomic Data Analysis
Functional Profiling Analysis
Interactive and highlighted Gene Ontology Graph Visualization
The GoGraphViz tool generates joined (multiple annotation sets) gene ontology graphs (directed acyclic graphs (DAGs)) to create overviews of the functional context of groups of sequences. Interactive graph visualization allows the navigation of large and unwieldy graphs often generated when trying to biologically explore large sets of sequence annotations. Zoom and graph navigation is provided through the DAG viewer Java Web Start tool.
Graph coloring and highlighted information content are provided through a colour scale proportional to annotation weight. A term annotation weight can be computed as the number of sequences annotated to that term or as an annotation confluence score. This confluence score (Node-Score) takes into account the number of sequences converging at one GO term and penalizes by the distance to the term where each sequence actually was annotated. Assigned sequences and Node-Scores can be also displayed at the term's level. Additionally, the visualization of a user-provided score was added to e.g. be able to visualize two groups of GO terms by separating under- and over-represented terms with two different colors.
The graph term filtering adds the ability to display the annotation result for a set of sequences on the Gene Ontology DAG. However, when the number of sequences to display is large, GO graphs can become extremely large and difficult to navigate. Additionally, the relevant information in these cases is frequently concentrated in a relatively small subset of terms. We have introduced graph pruning functions to simplify DAG structures to display only the most relevant information. A cut-off on the number of sequences or the score value can be set to filter out GO terms. The number of omitted GO terms is given for each branch, which is an indication of the level of local compression applied.
File format example
   Seq1	GO:0000001	0.1
   Seq2	GO:0000011	0.8
   Seq3	GO:0000015	0.6
   Seq4	GO:0000015	0.12
   Seq5	GO:0000027	0.45
   ...
   ...
Several images (jpg, svg, png) of the generated graph are given as Output. The graphs can also be downloaded in form of a textual representation. Further, a link (.jnlp) starts automatically the interactive graph visualization tool in form of a Java Web Start application.
We have a list of genes that are known to be involved in breast cancer. We want to inspect the joint biological meaning of this set of genes. How to proceed?
Take the list of genes (human) and find their annotations with “create annotation” tool under “processing data” in Babelomics. Therefore you have to upload the list of genes under “data upload” and select “ID-list→Genes”. Once the list in loaded into Babelomics you go the “create annotation” tool. Here you have to “browse” your data and select the list you uploaded. Deselect “all genome”. Afterwards you have to select the organism and the type of annotations you want to recover. Select all three GO categories. The output format has to be “extended”.
Than use the generated annotations with the GO Graph Viewer to visualize the ontologies (Babelomics –> Utilities –> GO Graph Viewer)
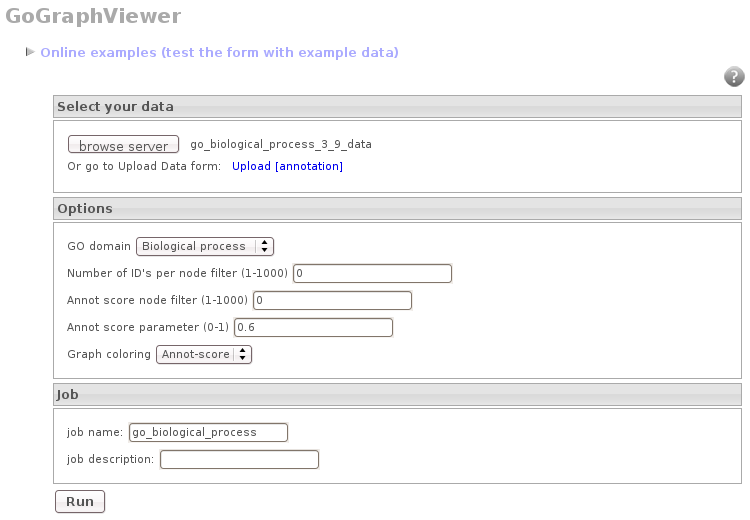
Use the browse button to select the generated annotation, select the corresponding GO category and press “RUN”.

Once the results are obtained you can download the graph as an image (png, jpg) or in a textual representation.
Additionally you have the option to view the graph with the interactive GOGraphViz tool by clicking in this icon:
