Presentation
Web usage
Data Management
Data Preprocessing
Expression Data Analysis
Genomic Data Analysis
Functional Profiling Analysis
In the last years the use of microarrays as predictors of clinical outcomes (van 't Veer et al., 2002), despite not being free of criticisms (Simon, 2005), has fuelled the use of the methodology because of its practical implications in biomedicine. Many other fields, such as agriculture, toxicology, etc are now using this methodology for prognostic and diagnostic purposes.
Predictors are used to assign a new data (a microarray experiment in this case) to a specific class (e.g. diseased case or healthy control) based on a rule constructed with a previous dataset containing the classes among which we aim to discriminate. This dataset is usually known as the training set. The rationale under this strategy is the following: if the differences between the classes (our macroscopic observations, e.g. cancer versus healthy cases) is a consequence of certain differences an gene level, and these differences can be measured as differences in the level of gene expression, then it is (in theory) possible finding these gene expression differences and use them to assign the class membership for a new array. This is not always easy, but can be aimed. There are different mathematical methods and operative strategies that can be used for this purpose.
Prophet is a web interface to help in the process of building a “good predictor”. We have implemented several widely accepted strategies so as Prophet can build up simple, yet powerful predictors, along with a carefully designed cross-validation of the whole process (in order to avoid the widespread problem of “selection bias”).
Prophet allows combining several classification algorithms with different methods for gene selection.
A predictor is a mathematical tool that is able to use a data set composed by different classes of objects (here microarrays) and “learn” to distinguish between these classes. There are different methods that can do that (see below). The most important aspect in this learning is the evaluation of the performance of the classifier. This is usually carried out by means of a procedure called cross-validation. The figure illustrates the way in which cross-validation works. The original dataset is randomly divided into several parts (in this case three, which would correspond to the case of three-fold cross validation). Each part must contain a fair representation of the classes to be learned. Then, one of the parts is set aside (the test set) and the rest of the parts (the training set) are used to train the classifier. Then, the efficiency of the classifier is checked by using the corresponding test set which has not been used for the training of the classifier. This process is repeated as many times as the number of partitions performed and finally, an average of the efficiency of classification is obtained.
Figure 1 - Cross validation
We have included in the program several methods that have been shown to perform very well with microarray data (Dudoit et al., 2002; Romualdi et al., 2003; Wessels et al., 2005). These are support vector machines (SVM), k-nearest neighbor (KNN) and Random Forest (RF).
In machine learning and statistics, feature selection, also known as variable selection, feature reduction, attribute selection or variable subset selection, is the technique of selecting a subset of relevant features for building robust learning models. When applied in biology domain, the technique is also called discriminative gene selection, which detects influential genes based on DNA microarray experiments
"A good feature subset is one that contains features highly correlated with (predictive of) the class, yet uncorrelated with (not predictive of) each other".
After ranking the genes by PCA, we examine the performance of the class prediction algorithm using different numbers of the best ranked genes and select the best performing predictor. In the current version of Prophet we build the predictor using the best 5, 10, 15, 20, 25, 30, 35, 40, 45 and 50 genes. You can choose other combinations of numbers anyway. Note, however, that most of the methods require starting by, at least, 5 genes.
If the gene selection process is not taken into account in the cross-validation, the estimations of the errors will be artificially optimistic. This is the problem of selection bias, which has been discussed several times in the microarray literature (Ambroise & McLachlan 2002; Simon et al. 2003). Essentially, the problem is that we use all the arrays to do the filtering, and then we perform the cross-validation of only the classifier, with an already selected set of genes. This cannot account properly for the effect of pre-selecting the genes. As just said, this can lead to severe underestimates of prediction error (and the references given provide several alarming examples). In addition it is very easily to obtain (apparently) very efficient predictors with completely random data, if we do not account for the pre-selection.
The optimal number of genes to be included in a predictor is not know beforehand and it depends on the own predictor and on the particular dataset. A rather intuitive way of guessing about it is by building predictors for different number of genes (see above). Unfortunately, by doing this we are again falling into a situation of selection bias, because we are estimating the error rate of the predictor without taking into account that we are choosing the best among several trials (8 in this case).
Thus, another layer of cross-validation has been added. We need to evaluate the error rate of a predictor that is built by selecting among a set of rules the one with the smallest error.
The cross-validation strategy implemented here return the cross-validated error rate of the complete process. The cross-validation affect to the complete process of building several predictors and then choosing the one with the smallest error rate.
The file with the gene expression values must be compliant with the Babelomics format, that is, rows represent genes, and columns represent arrays (samples, tissues, individuals, etc.) Array labels can be provided for easier interpretation of the results. To do that, add in the header of the file a line stating by “#NAMES“ or “#names“ and then list one label per array separated by tabulators.
Importants things to take into consideration:
An extra file defining the classes to which the arrays belong to must be provided.
Separate class labels by tab (t), and end the file with a carriage return or newline. No missing values are allowed here. Class labels can be anything you wish; they can be integers, they can be words, whatever.
All labels must be in one line. As before, the line can't end with a tabulator and the lines startong with # will not be considered
This is a simple example of class labels file
#VARIABLE TUMOR CATEGORICAL{ALL,AML} VALUES{ALL,ALL,ALL,ALL,ALL,ALL,ALL,AML,AML,AML,AML,AML} DESCRIPTION{}
In this example we are going to analyse a dataset from Golub et al. (1999). In that paper they were studying two different types of leukaemia (acute myeloid leukemia (AML) and acute lymphoblastic leukemia (ALL) in order to detect differences between them. This dataset have 3051 genes and 38 arrays, 27 of them labeled as ALL and 11 of them as AML.
Using Prophet we are going to build a predictor to try to distinguish between both classes. In the train file we can see 30 arrays, 22 ALL and 9 AML. The rest, 6 ALL and 2 AML, are in the test file for predicting.
You can find the dataset for this exercise in the following files:
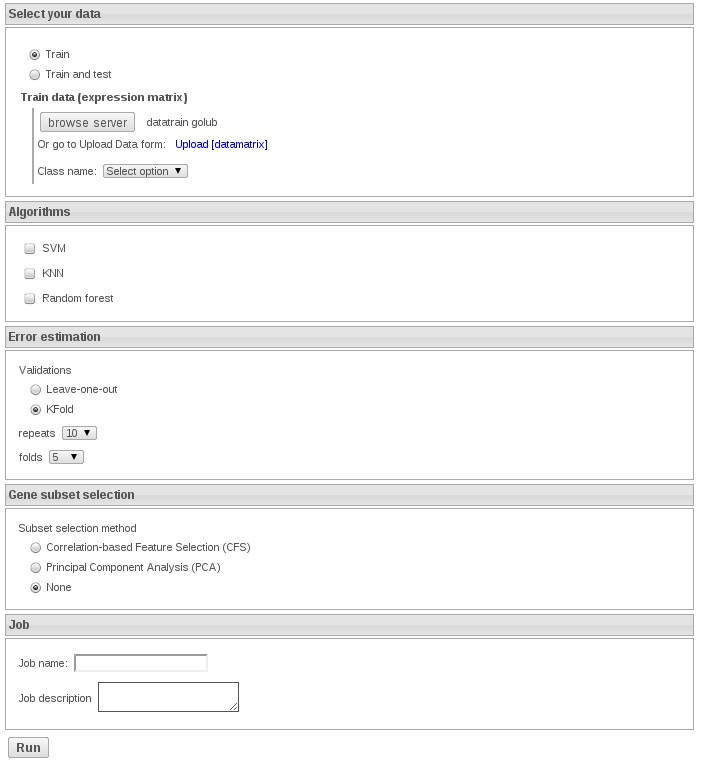
1) Train with knn: Upload the datafile and select the variable TUMOR

In order to get the exercises fast select 5 repeats of 5-fold cross validation. In this exercise do not select any feature selection method.
2) Repeat the exercise but select CFS feature selection method, which one works better? why? how many genes were selected
3) Now try with svm with no feature selection method, which one performs better? SVM or KNN
4) To finish you can try SVM with CFS feature selection method, how many features were selected? why it matches KNN with CFS?
5) Finally, which is the bes combination? why is SVM doing better alon than with CFS?
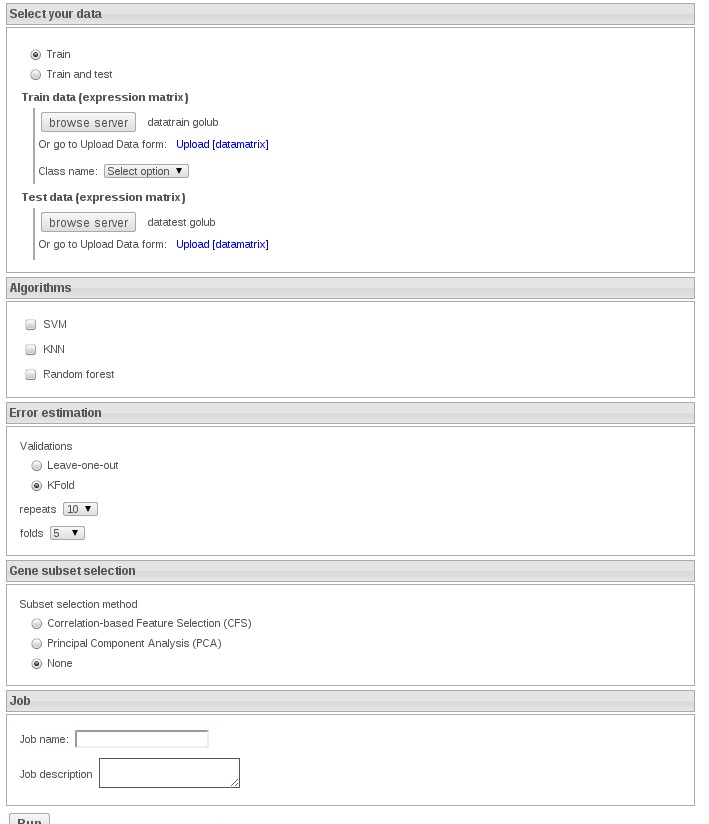
Now we select the option Train and test and select datatraingolub and datatestgolub:

We can select KNN without feaure method to speed up the exercise.
In order to check the accuracy of prediction you can see the correct labels for the test file:
ALL ALL ALL ALL ALL ALL AML AML
Are the predictions right? Do you get the same results with SVM?