Differential Expression Analysis

In this example we are going to perform a complete differential expression analysis with Babelomics.

1. Get an experimental DataSet1)

We are interested in analysing the differencies between cases and controls in Pulmonary sarcoidosis:

  • Take a look at the some information provided in the experiment's description: summary, sample description, authors, PubmedID. Focus your attention on information concerning the microarray chip and the samples. We can see that they have 12 samples (6 cases and 6 controls) and that the platform used is Affymetrix Human Genome U133 Plus 2.0 Array.


GEO Experiment

  • The file downloaded “GSE16538_RAW.tar” contains the necessary CEL files to go on with our study. If you are interested, you can uncompress the file and inside you will see other 12 compressed files. Each file corresponds to a single sample. Here you have the sample information for GSE16538 DataSet.

2. Upload your data2)

  • Go to Upload data and upload the GSE16538_RAW.tar file that you have just downloaded.

3. Data Preprocessing

Normalization3)
The purpose of normalization is to adjust the data for unwanted invalances, drifts or biases and make possible the comparison between samples. Preprocessing includes three steps: background correction, between array normalization and reporter summarization.
  • Since our DataSet uses a single color Affymetrix platform, go to Processing data > Normalize > Expression > One-channel > Affymetrix
    1. Browse in the uploaded data and select the raw data of our DataSet (the one you have just uploaded).
    2. Tick RMA4) as the analysis method.
    3. Insert a job name (we will call it 'rma_sarcoidosis') and Run.
    4. When the process have finished, go to Job list in the right menu and click on it ('rma_sarcoidosis' in our case).
      There you can see a summary of the Normalization process.
      Focus your attention now on the plots provided:

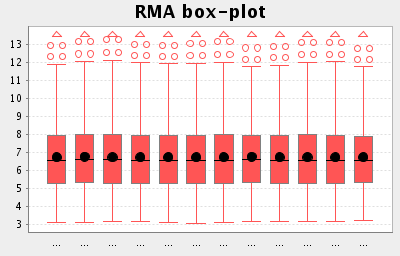
      - Box-plot: represents the distribution of intensity measurements of one array. You would expect all of them to show the same shape. If you are normalizing two color arrays you will also expect all of the boxes to be centered in zero.

      Box plot
      As expected, all samples show a high resemblance in shape and also share a similar median value (around 6.5).
      However, it may happen that we have a problematic sample. We will identify it because low-quality arrays are significantly elevated or more spread out, relative to the other arrays. Click here to see an example of box-plot with a problematic sample.

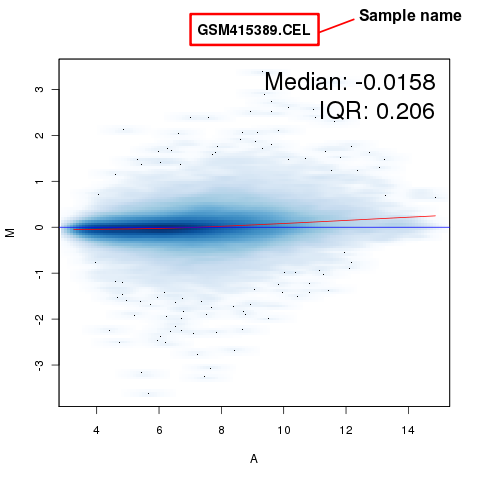
      - MA plot: we will find one MA plot per sample. It represents the normalized intensity distribution of each sample against a consensus mean sample. A LOESS line fitting the trend between M and A values is drawn in red. After normalization you expect no trend in the LOESS line, that is, you expect it to be as close as possible tho the horizontal 0 axis.

      MA Plot
      All samples seem to be correct so, we can go on with the preprocessing.

    5. Go to Data list in the right menu. You will see a file called 'rma.summary'. This file contains the expression data matrix generated after the normalization. You can download it5) if you want to see its format. Here you have an example:

      Data matrix

Edit data
With this step we can assign to each sample the correspondent experimental conditions or parameters. This is an essential feature of the relationship between the assay and the sample data.

  • Go to Processing data > Edit and create a new variable.6)
    1. Browse in Job generated the expression data matrix created in 'rma_sarcoidosis'.
    2. Create a Variable called 'PHENOTYPE' with values 'NORMAL' and 'SARCOIDOSIS'.
    3. Assign the correspondent value to each sample according to the information provided in the experiment and Submit. At the end you will have something like this:

      Edit data

4. Differential Expression Analysis 7)

Our objective is to analyze differential gene expression between a sarcoidotic and a normal lung. So, we are going to carry out a two-class comparison. For further information about class comparison go here
  • Go to Expression > Differential expression > Class comparison.
    1. Browse in Job generated the expression data matrix created in 'rma_sarcoidosis'.
    2. Select the class name 'PHENOTYPE'. Automatically, you will see two drop-down menus with the values to compare. For our case, choose 'NORMAL' in one of them and 'SARCOIDOSIS' in the other.

      Select class to analyse

    3. Set Limma8) as the test to apply.
    4. Set also Benjamini and Hochberg (BH), FDR as the multiple-test correction.
    5. Set the adjusted p-value in 0.059).
    6. Submit and when the job has finished, take a look at the results.

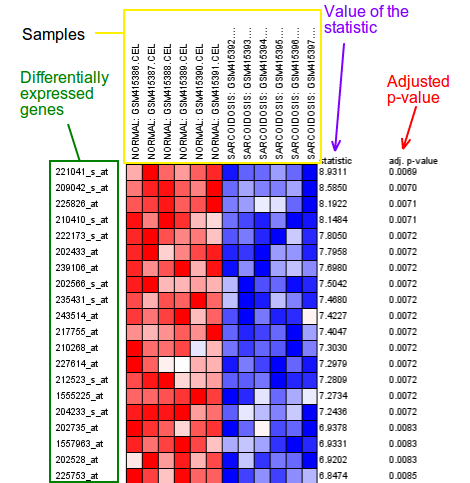
      Heatmap

      What you can see after the analysis is a heatmap with the intensities for these genes that are significantly differentially expressed. Each gene is represented in a row and each condition or array is represented in a column. High intensity measurements of gene expression are represented in red colors while blue colors represent lower measurements. Genes are sorted according to their expression patterns in the same order as they are in the output file. Experimental conditions or arrays are ordered depending on their labels.

      Files to dowload

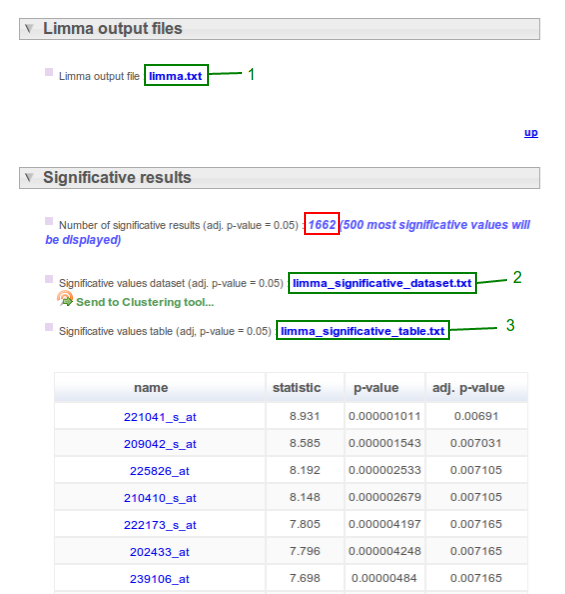
      The red square in the image above this words shows the number of genes differentially expressed in a significant way. In green, all the files you can download just clicking:

      - 1. Limma output file: this file contains a table with the statistic value, p-value, and adjusted p-value for each one of the genes in the array.
      - 2. Significative values dataset: An expression data matrix10) only containing the most significant 500 genes differentially expressed.
      - 3. Significative values table: As well as in 'limma output' (1), it is a file contains a table with the statistic value, p-value, and adjusted p-value but just for the most significant 500 genes which are differentially expressed.

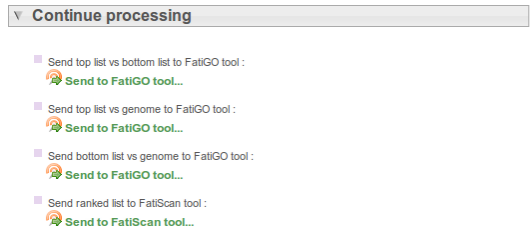
      At the bottom of the page you will see a collection of links which will help you go on with the Functional profiling analysis11).

      Continue processing
1) For further information on How to get an experimental DataSet go here.
2) For further information on How to upload data go here.
3) For further information about Normalization go here.
6) For further information about data edition go here.
7) For further information about Differential Expression go here.
11) To continue with this analysis, click here.
differential_expression_example.txt · Last modified: 2017/05/24 10:36 (external edit)
Driven by DokuWiki Recent changes RSS feed Valid XHTML 1.0 do yourself a favour and use a real browser - get firefox!!